Creating Reports in WordPress with Report Builder Wizard
All reports in Report Builder are created (and edited) in an intuitive step-by-step wizard. There is no global configuration for the plugin at all, and each wizard step has just several controls. In fact, the most important step of creating a report is to prepare a DOCX or XLSX template in Word or Excel (see the rules here), wizard is used just for fine-tuning.
Let’s take a quick look at each step.

The first step has only one control. The selection of a wpDataTable that will be used as a data source for this report. If the report does not need a wpDataTable (i.e. it will use only the data taken from user input), you can click “Next” without choosing a wpDataTable.
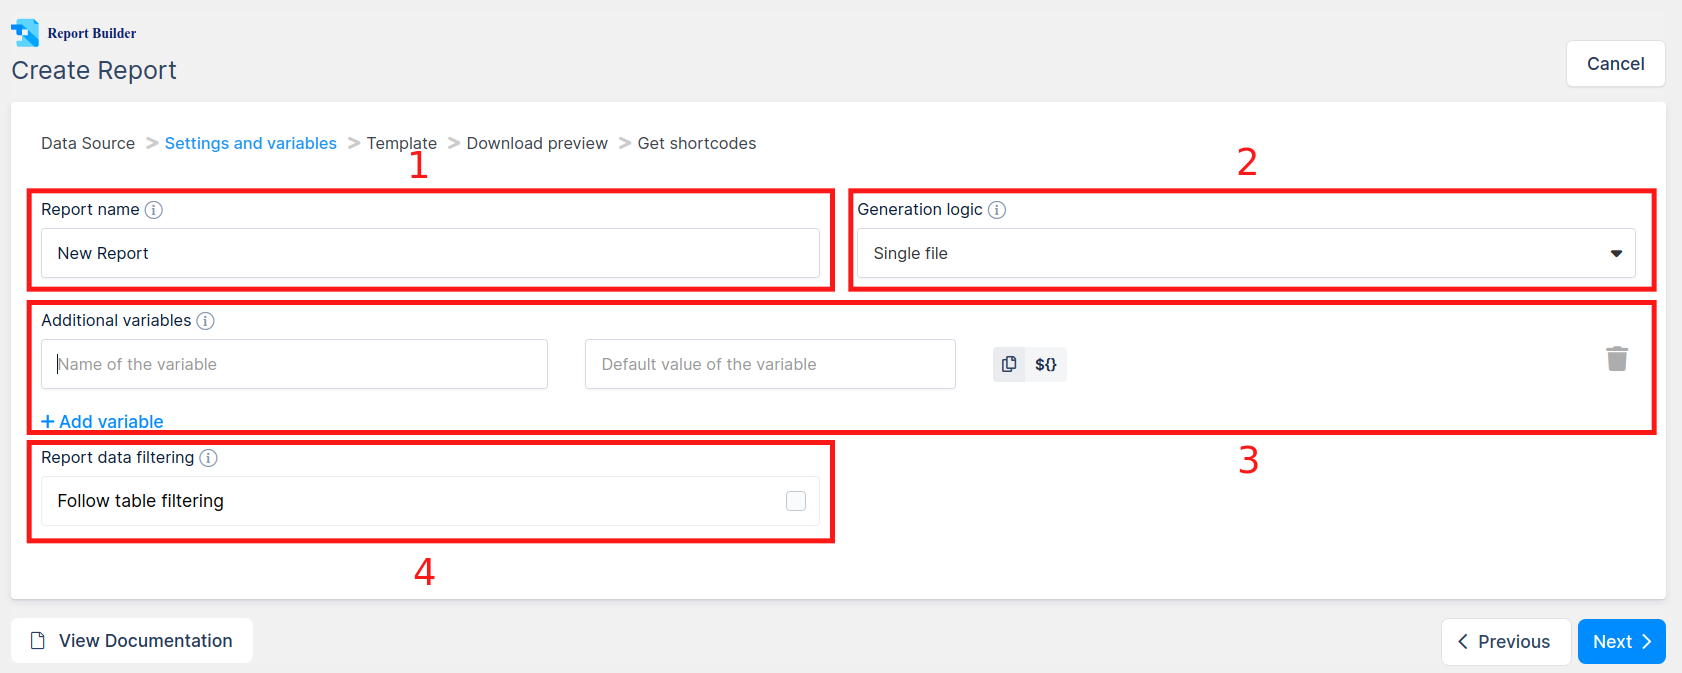
The second step is the main configuration step for the report. It contains most of the settings relevant to the generation logic on the WordPress side.
It has several sections:
1. Report name – here you can provide a name for the report. The name can be used in the template as a variable. It will be used to generate the filename on download and will help you to identify this report on the browse page.
2. Generation logic – this section is visible only if you choose a wpDataTable data source in the previous step. The selection defines whether a report builder will generate a single file for all table rows or a separate file for each table row. The first case is applicable when you need e.g. to download and print a list of transactions (see an example here). Second is better when e.g. you need to download and print the salary breakdown for a table separately for each employee (see an example here).
If you choose to generate multiple files in a ZIP, you can additionally provide a filename mask which will be used to name each single generated report file. When you generate a bulk report (whether Excel XLSX or Word DOCX) you will receive a ZIP archive with potentially a lot of files inside it, so it is important to have explicit names of files so you would always know which file contains which report. Filename masks are the patterns that allow you to define how the generated files will be named.
The default mask is ${reportname}-${count} (which means it will use the report name that you provided and the row number). You can use cell values in the mask, see the rules of filename mask here.
3. Additional variables section. Here you can define any number of additional variables – replaceable blocks of data in the report, that do not exist in the provided data source. E.g. number of documents, additional notes, customer name, and anything else. All variables can have a default value, but can also have a front-end input where the front-end users would be able to change it.
You can add a variable by clicking the “Add variable” button. A new variable block will appear. For more information about Additional Variables, please see this.
4. Follow table filtering – this checkbox is visible only if you choose a wpDataTable data source in the previous step. If this is checked, the report will always contain only the rows that are currently visible in the wpDataTable when it’s placed on the same page, in the same order. So if a table is sorted, filtered, etc., the rows will be used in the report the same as they appear on the page. If this checkbox is unchecked, or if the wpDataTable isn’t present on the same page with Report controls, the whole table will be used in a report every time. Important notice: if the table has more rows that are currently visible, the invisible ones won’t be used in the report if the follow table filtering – to use them you would need to select “All” in wpDataTables “Show … rows” dropdown on the front-end.


On the next step you need to provide a DOCX or XLSX template file which will be used for the report. The template must be on the same domain, the best approach is to upload it using the standard WP Media Library uploader (click “Browse…“, then drag&drop the prepared template file, and click “Choose the template file“).
See the rules how to prepare the template files here.
If you do not provide a file, you won’t be able to move forward.
Now all the preparations are done, and we just need to make sure that our report works as expected. On this step you can download a preview of the report, and see if everything works correctly. All additional variables will be replaced with default values. If you selected a wpDataTable as data source on the first step, you can also pick how many rows to use in the preview (as with large wpDataTables it can take quite a lot of time to generate a report). If something is wrong you can go back, change the settings or upload a different template, and go back to this step.
When everything is fine, click “Save report” to save the report in the database.


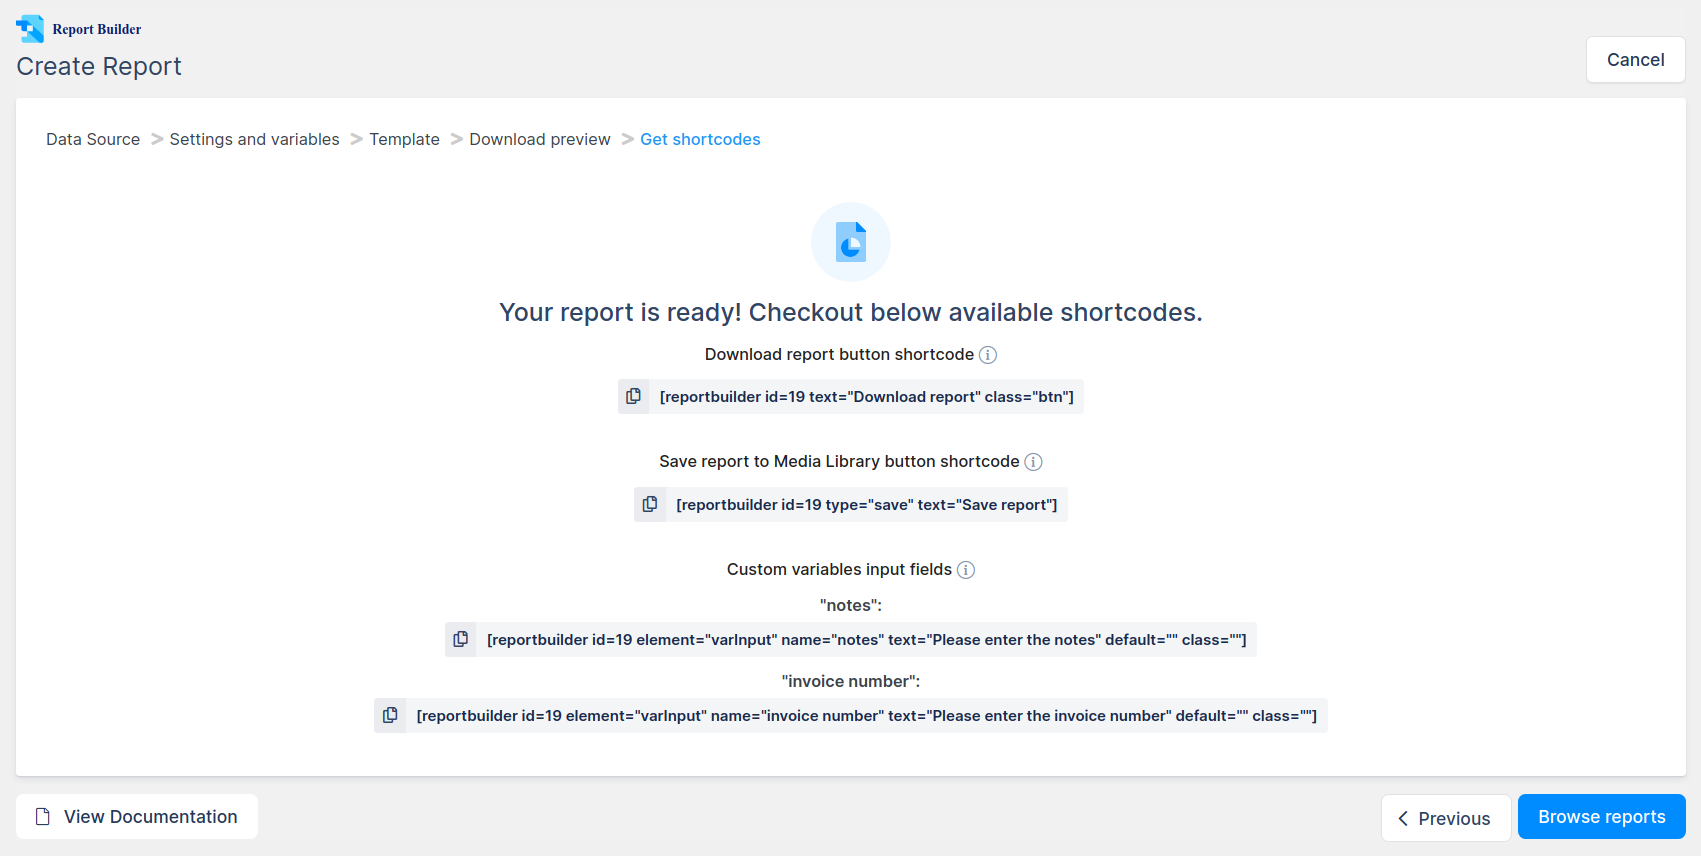
Now the report is saved, and this last step only shows you the list of shortcodes that you can paste in your posts or pages to generate the repots there. Shortcodes can generate inputs for additional variables, download button, and save to media library button. However, you do not need to copy these shortcodes now, as you can always generate them via default WordPress’ Visual Editor (see how), or WPBakery Visual Composer (see how).
To see a full walk-through example of creating a report, click here.